The MATISSE instrument
MATISSE (Multi-Aperture mid-Infrared SpectroScopicExperiment) is a second-generation interferometry instrument for the ESO Very Large Telescope Interferometer (VLTI). The interconnection of three or four telescopes makes it possible to capture visibilities and closure phases and allows pictures in the mid infrared range to be reconstructed. The maximum baseline length of 200 m (the distance between two telescopes) makes for a high resolution in the generated images.
Overview
MATISSE operates in the wavelength range from 2.8 µm to 13 µm. The combined light of the telescopes is spectrally dispersed in order to measure the wavelength dependence of the visibility and closure phase. Two imaging sensors are used to cover the wide wavelength range. One imaging sensor (HAWAII/2RG) covers the wavelength range of the L and M bands (2.8 µm to 5.2 µm), and the other imaging sensor (Aquarius) covers the N band (8 µm to 13 µm). The HAWAII 2RG imaging sensor features low readout noise, while the Aquarius imaging sensor provides a high readout rate. The Aquarius imaging sensor provides precise measurements despite the high thermal background radiation.
 |
Object classes: Active Galactic Nuclei, protoplanetary disks, evolution of planetary systems, birth of massive stars, environment of hot and evolved stars |
 |
Atmosphere |
|
Telescopes: ESO VLTI |
 |
Delay Lines ESO Delay Lines |
 |
Optics: Warm and cold optics |
|
Imaging sensors: HAWAII-2RG, AQUARIUS |
 |
Electronics: ESO NGC (Next Generation Controler) |
 |
Instrument Control Software: MATISSE DCS (Detector Control Software) developed by our group |
 |
Data Reduction Software: MATISSE DRS (Data Reduction Software) partly developed by our group |
Our Work
Our group is responsible for two main parts of the MATISSE Software: the Detector Control Software (DCS) and the Data Reconstruction Software (DRS).
MATISSE Detector Control Software (DCS)
The Detector Control Software is part of the instrument software. It is responsible for controlling the readout electronics and receiving and recording the data from the imaging sensors.
Overview of the MATISSE software
As shown in the image below, the individual components of the instrument software run as independent processes on different computers. The instrument hardware is controlled by two Local Control Units (LCUs), which in turn control several actuators (motors, servos, and piezomechanical positioning units) and read the sensors (for temperature, pressure and position).

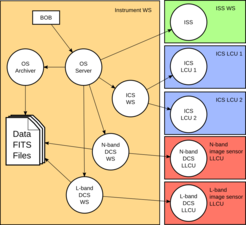
One Linux Local Control Unit (LLCU) is responsible for each imaging sensor. The LLCUs control the readout electronics and receive, preprocess and relay the image data. An Instrument Workstation (IWS) connects the four computers and simultaneously serves as the interface to the telescopes, the optical delay lines and the observatory’s data archive. The local network of the instrument relays the control command, the status information and the image data between the specified computers.
The software is made up of the following components:
- Instrument Control Software (ICS):
- Interfaces to the hardware are provided on both LCUs. In some cases, real time requirements must be fulfilled.
- Higher-level interfaces and a graphical operating interface are provided on the IWS.
- Detector Control Software (DCS):
- A control process for controlling the connected readout electronics runs on both LLCUs. Additionally, the received raw data is preprocessed and sent to the IWS.
- One process per imaging sensor on the IWS is responsible for sending the commands to the Observation Software and receiving and recording the image data.
- Observation Software (OS):
- The graphical operating interface on the IWS controls all of the instrument’s components. The sequence control of the observation is also handled by the OS.
Detector Control Software (DCS)
The Detector Control Software controls the readout electronics and prepares, displays and records the raw images. This functionality is fulfilled by specialized software components that are part of the ESO software package.
Our group is responsible for implementing the MATISSE-specific requirements. This primarily includes the preparation of the raw images, the distribution of these images to a special processing process and the storage in a special format called FITS files. The raw data are not images in the traditional sense but rather a combination of spectrally dispersed interferograms, spectra and reference data. These different types of information are separated and saved in the same file. Furthermore, additional information from the instrument (for example, which filter was used) is also saved in the file. The high frame rate of the N-band imaging sensor leads to a data rate of approximately 192 MByte/s directly on the output of the readout electronics. The preprocessing, transfer and storage of this raw data requires an efficient way of handling the available resources (network, processing capacity and memory bandwidth).
MATISSE Data Reduction Software (DRS)
Real images can be reconstructed by the Data Reduction Software from the raw data and the calibration data (dark current image, flat-field image and bad pixel map) through several intermediate stages (calibrated interferograms, interferometric raw data and calibrated interferometric raw data). Other tasks of the Data Reduction Software include the generation of the calibration data and the supervision of both imaging sensors.
Principles of interferometric observations with MATISSE
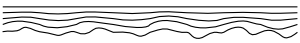
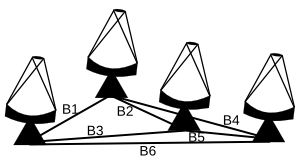
Optical long-baseline interferometry superimposes the light of an astronomical object (for example, a star) from two or more telescopes. (The light is said to be “brought to interference.”) The result is an interference pattern that contains the information about the appearance of the astronomical object (image). This information is just encrypted, so to speak, which is aggravated by the fact that the interference pattern can be disrupted as a result of influence from the earth’s turbulent atmosphere. In the case of MATISSE, this is very similar to the double slit experiment. One slit is used per telescope. In order to obtain a complete image, several images must be taken with varying distances between the telescopes and different telescope orientation in relation to the object. Following this, a real image can be reconstructed with the help of Fourier methods.
Data Reduction Software (DRS)
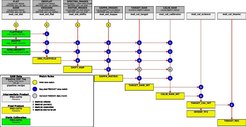
Raw data are processed by the data reduction software in subsequent steps resulting in a fully reconstructed image. The processing steps are implemented as a set of ESO Common Pipeline Library (CPL) recipes. All processing steps can be run at ESO in Garching and on every VLTI-Software-compatible computer. Moreover, the first processing steps are executed directly at the observatory on Cerro Paranal so that the quality of the measured data can be assessed during the observation night.
The processing of the data from an observation is divided into the following steps:
- Conversion of the raw images into calibrated interferograms and spectra.
- Calculation of the raw interferometric data (visibility and closure phase).
- Calibration of the raw interferometric data.
- Reconstruction of an image from the calibrated data.
We additionally work on the following processing steps, which serve to calibrate the data and monitor the instrument:
- Calculation of both flat field maps from special raw data
- Ascertainment of the bad pixels (bad pixel map)
- Monitoring of the imaging sensors to be sure that they continue to work according to the defined specifications and to check for any external disturbances (daily checks).
Raw data calibration
In the first stage, the available raw frames stored as FITS files are calibrated. Additional calibration data, such as the flat field map, the bad pixel map and the distortion map, are used to remove instrument and detector effects from the data. Detector effects are, for example, an offset of the pixel values, dead pixels and irregularities in illumination and/or the pixel gain (flat field). Due to the optics used, the image is distorted in the instrument, and this must be corrected. There is an especially strong thermal background in the N band, which must be removed in order to receive this weak signal of an astronomical object.
The steps for converting the raw data into a calibrated interferogram are as follows:
- First, either the dark current or the sky background is removed from the raw data.
- The irregular illumination and the location-dependent gain are compensated for with help from the flat field map.
- The defective pixels (marked in the bad pixel map) are interpolated from the surrounding values.
- The optical distortion is removed.
- The uneven dispersion of the light on the photometric channels and the interferometric channels is compensated for.
The data reconstruction software is written in ANSI C and is fully integrated into the ESO pipeline software.
Image Reconstruction
The developed image reconstruction software can reconstruct images of an astronomical object observed with an optical/IR interferometer like the ESO VLTI. The calibrated interferometric data (visibility and closure phase) serve as the foundation. However, it should be noted that only an incomplete set of data can be obtained due to the limited number of telescopes, their distance from each other and the limited amount of observation time. The missing information must be compensated for with suitable supplements, but this is only partly successful. Therefore, it is generally only possible to obtain an approximate image of an astronomical object.
The goal of reconstruction is to find an image that has the smallest distance from the measured values. This distance, however, refers to the Fourier plane, not the concrete 2D image. The supplemental information is combined with this distance. Beginning with the starting image, an iterative process is used to try to modify the image and until the smallest distance is obtained (reconstruction). A nonlinear optimization problem arises as a result of the large number of pixels in the reconstruction process, the numerous measurements and the nonlinearity of the distance function. It is therefore important to carefully select the starting image for the iteration process. Otherwise, the process can get bogged down in a local optimum (wrong image).
The data reconstruction software is written in ANSI C and is fully integrated into the ESO pipeline software.

Project milestones
- Kick-off meeting in November 2006
- Phase-A study in July 2007
- Preliminary Design Review in December 2010
- Final Design Review in April 2012
- Present status: After the Final Design Review 2012, the manufacturing of the instrument subsystems began. The integration of the cold optics and detector in the cryostat is planned for the second half of 2013.
- Preliminary Acceptance Europe: 2015